Differentiation instead of mean.
Soil, yield potential and nitrogen requirements vary spatially.
We systematically identify these differences.
Understanding location differences instead
manage uniformly.
Many decisions in the company are based on average values.
But no blow is average.
Soil, yield potential and nitrogen requirement often differ within a few meters.
Those who fail to systematically identify these differences,
works with flat rates.
This reduces earnings potential and increases uncertainty.
and weakens the efficiency of the N-strategy.
Why one-size-fits-all solutions cost potential
- SLocation differences are real – even within a few meters.
- Nitrogen requirements and yield potential vary significantly.
- Biomass development does not follow a uniform logic.
- Uniform rates ignore these differences.
A scattershot approach is no substitute for site analysis.
How we make location differences measurable
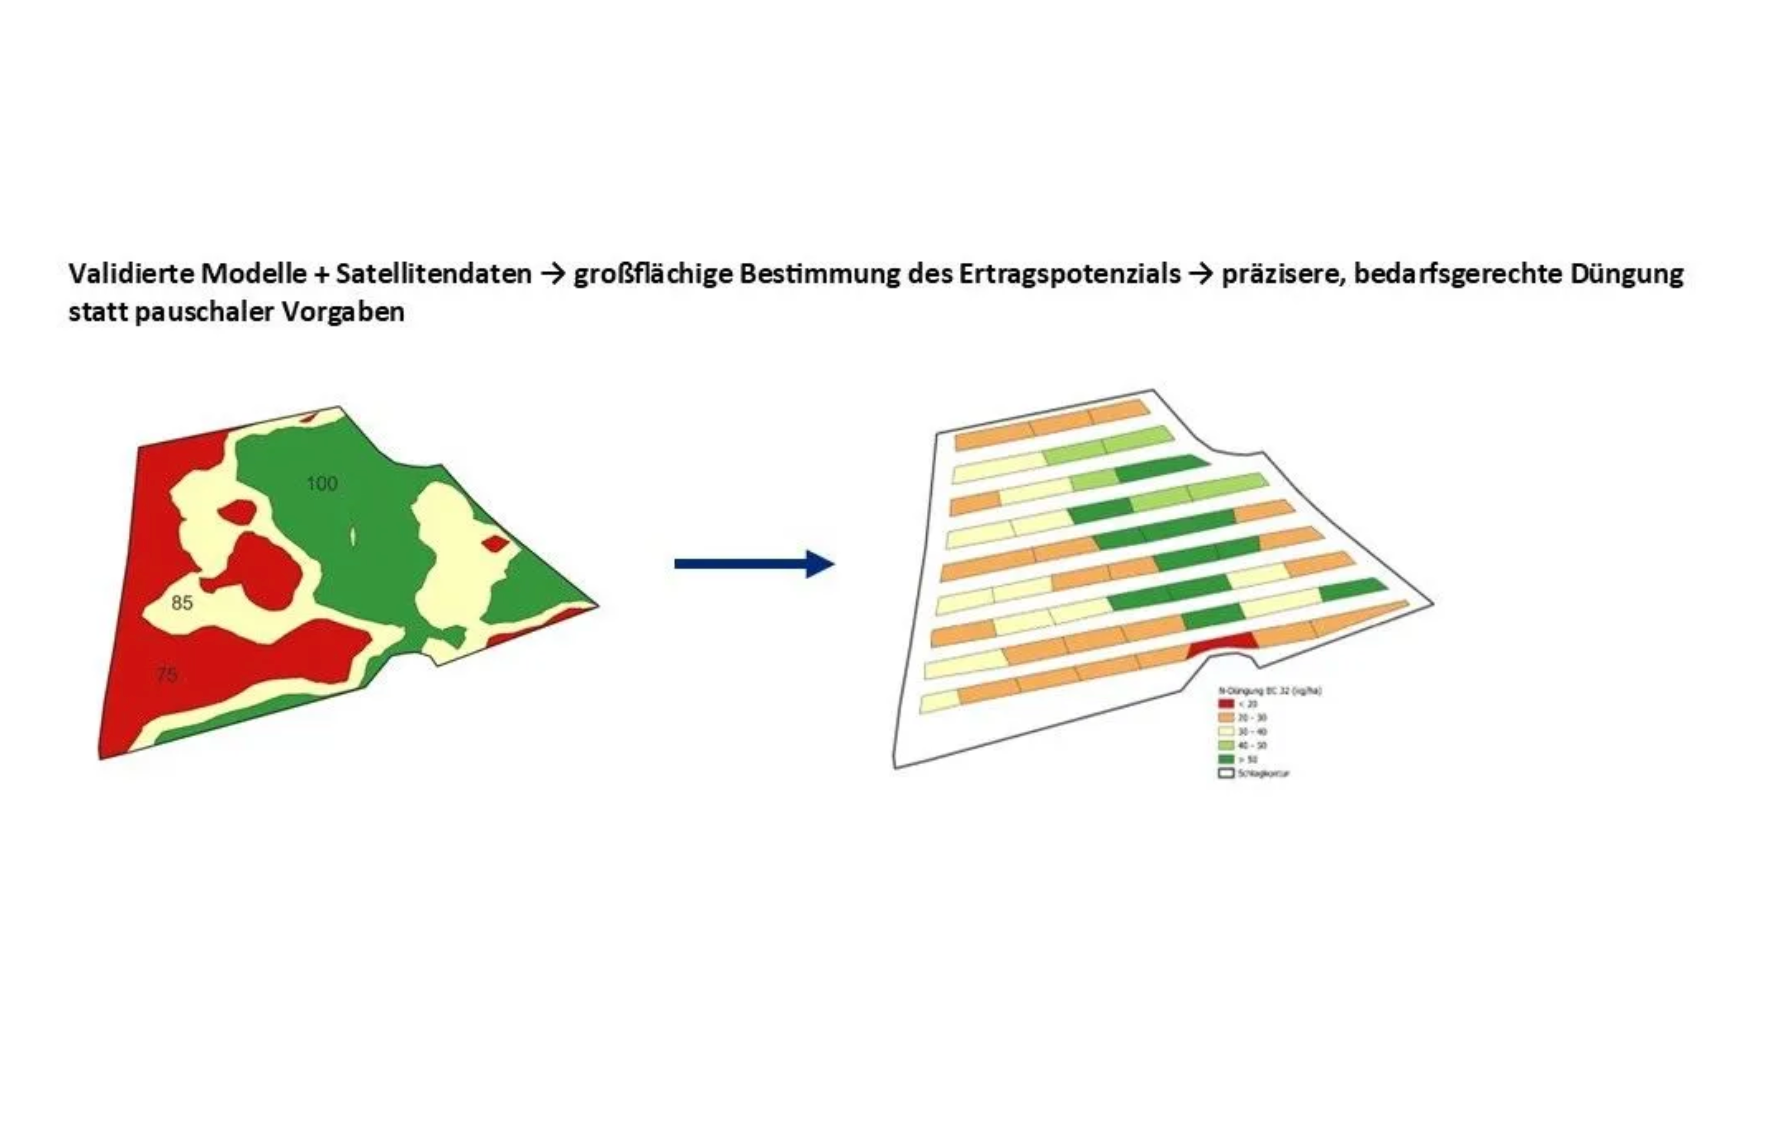
YieldXperts systematically and data-based identifies spatial differences – in agricultural operations
We combine:
- Satellite and remote sensing data
- Soil and yield information
- scientifically sound models
- multi-year validation on practice premises
The result:
Grid-based assessments as a basis for location-appropriate management.
Yield potential analysis
What it's about
Site-specific assessment of biomass and yield potential at grid level.
Contains
- Yield potential maps
- Biomass assessment
- Differentiation within a stroke
- Basis for economic optimization
Target audience
agriculture
👉 Analyze earnings potential
Differentiated N-strategy
What it's about
Site-based derivation of nitrogen requirements and fertilization strategies.
Contains
- Grid-based fertilizer requirement determination
- Consideration of earnings potential
- Minimizing N-risks
- Documentation basis
Target audience
agriculture
👉 Determine fertilizer requirements precisely for each location
What has improved
For your business
- Targeted use of earnings potential
- Use N appropriately for the location
- Use resources efficiently
- Increase documentation security
- Make decisions based on reliable data
Start differentiation now
Making the location reality visible –
for economic decisions
Knowledge instead of estimation
Our models deliver clear key performance indicators instead of assumptions.
This provides farmers with the basis,
to act purposefully,
To manage resources intelligently and
Balancing environment and production.
Thus, an estimate becomes
precision – and out of risk
Planning certainty.
We make visible what is hidden.
What if we considered these differences?
can no longer be guessed, rather
clearly recognize
could?
If every square meter of a field showed,
what he can do?
This is exactly where we come in:
With high-resolution satellite data, Soil information and scientifically validated models we do Making invisible potentials visible - for targeted management.
Our products